
Dr Mark Jones
[This blog post was written by Dr Mark Jones and originally published on the Originally posted on the cebm blog on 11 Feb 2015. ]
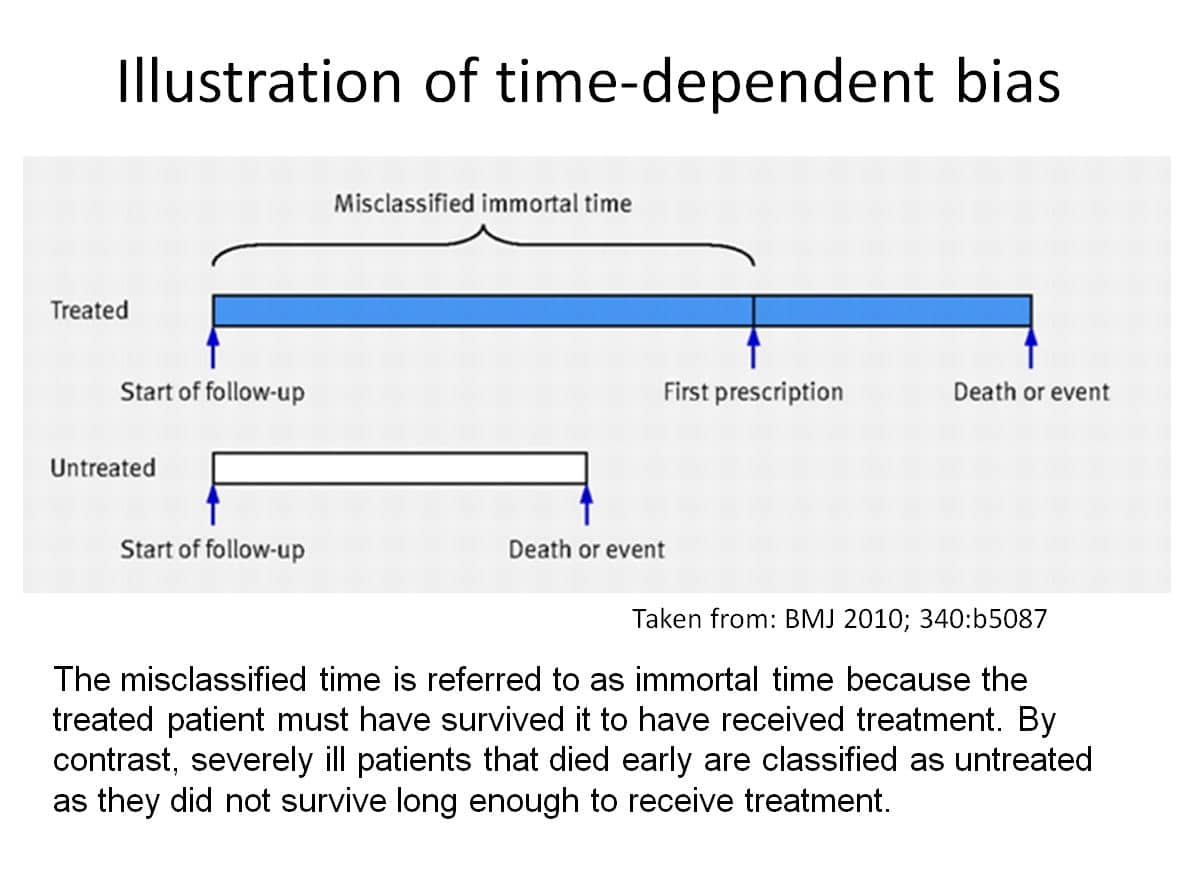
Time-dependent bias is not an issue in randomised studies as treatment (including placebo) is given at the beginning of follow up for each treatment group compared. However in observational studies, treatment exposure often occurs sometime after initiation of a study. An analysis that does not take account of this delay misclassifies time at risk of outcome prior to treatment as being associated with treatment when in fact it is associated with no treatment. So for example if the treatment group has 100 patients followed for an average of 10 days from hospital admission and 20 die, a naïve mortality rate is 0.020 deaths per patient day (20 deaths in 10×100 = 1000 patient days). If 100 untreated “control” patients are followed for an average of 10 days and 25 die then the crude mortality rate is 0.025. A ratio of mortality rates (0.80) suggests treatment reduces risk of death by 20%. However if the average delay from admission to treatment is 1 day we have misallocated time at risk and 100 patient days (1 day for each of the 100 treated patients) should be subtracted from the treatment group and added to the no treatment group. This leads to a corrected mortality rate of 0.0222 for treated patients and 0.0227 for untreated patients hence a reduced ratio of mortality of 0.98.
This example illustrates that taking account of time-dependent exposure reduces the treatment effect in favour of treatment (from 20% risk reduction to 2% risk reduction).
In fact Beyersmann et al prove this is always the case. Any reported effect of time-dependent treatment exposure on outcome is at risk of bias if the time-dependent nature of treatment is not taken account of appropriately. Furthermore the bias is always in the direction of making treatment look better than it really is.
This point is illustrated further in an observational study on oseltamivir for treatment of critically ill patients in Canada during the 2009 influenza pandemic (Kumar, et al 2009). Of 578 patients, 540 got oseltamivir (of which 105 (19%) died) compared to 38 who did not get antiviral (of which 12 (32%) died). A simple chi-square test gives weak evidence of a difference in survival (P=0.072) and Cox regression assuming treatment exposure occurs at hospital admission provides evidence of reduced risk of death for patients getting oseltamivir (Hazard Ratio(HR) = 0.52, 95% CI: 0.29 to 0.95, P=0.033). See Table 1 for a life table and Figure 1 for a Kaplan-Meier plot of the data assuming treatment exposure occurred at hospital admission.
An alternative analysis that takes into account the fact that treatment with oseltamivir does not occur at hospital admission but rather occurred at a mean of 0.62 days (range 0 to 45 days) after hospital admission shows a markedly different result. Cox regression assuming time dependent treatment exposure gives no evidence of reduced risk of death for patients getting oseltamivir (HR = 0.87, 95% CI: 0.48 to 1.61, P=0.66). See Table 2 for a life table and Figure 2 for a survival plot of the data using the method of Simon and Makuch (1984).
The life tables and survival plots are shown for the first 12 days as this is where most of the mortality occurred. When standard survival analysis is used there is an implicit assumption that treatment exposure begins at baseline which in this case is hospital admission. Therefore at baseline there were 540 patients at risk in the oseltamivir group and 38 patients at risk in the no-treatment group (Table 1, Figure 1). This incorrect assumption is what leads to time-dependent bias.
In the alternative analysis the timing of exposure to treatment is taken account of correctly by considering how many patients were exposed or unexposed to treatment on a daily basis. If we had the data we could do this more accurately, for example, on an hourly basis. Table 2 shows that in fact there were only 423 patients exposed to oseltamivir in the first 24 hours of hospital stay. By simple subtraction we also know that 155 patients had no exposure to oseltamivir during the first 24 hours of hospitalisation. This more accurate data then leads to more accurate estimates of the cumulative mortality. If we were to use hourly data we would obtain more accurate estimates and reduce time-dependent bias further.
Time-dependent bias is an important issue for any observational study that assesses the effect of a treatment exposure occurring sometime after initiation of the study. In the context of oseltamivir for treatment of influenza there appears to be no published study that has addressed this bias appropriately. This is particularly important for studies with high mortality rate (i.e. severely ill patients) and studies with the majority of patients treated. The reasons are that high mortality will tend to increase the bias as more patients die before treatment can be given; and few untreated patients means that those dying before initiation of treatment would tend to have a large influence on the odds of dying in the untreated group as most patients who survive long enough to get treatment do get treatment.
Acknowledgement: I am very grateful to Anand Kumar and Rob Fowler for providing the Canadian individual patient data.
References
Beyersmann, J., Gastmeier, P., Wolkewitz, M., Schumacher, M. An easy mathematical proof showed that time-dependent bias inevitably leads to biased effect estimation. Journal of Clinical Epidemiology. 2008; 61: 1216-21.
Kumar, A., Zarychanski, R., Pinto, R., et al. Critically Ill Patients With 2009 Influenza A(H1N1) Infection in Canada. JAMA. 2009; 302(17):1872-9.
Simon, R. and Makuch, R. W. A non-parametric graphical representation of the relationship between survival and the occurrence of an event: Application to responder versus non-responder bias. Statistics in Medicine. 1984; 3: 35-44.
Table 1: Time from admission to death by time fixed treatment status (AV=antiviral)
| Days since admission | Number at risk (AV) | Number dead (AV) | Cumulative mortality (%) (AV) | Number at risk(no AV) | Number dead(no AV) | Cumulative mortality (%) (no AV) |
| 1 | 540 | 4 | 0.7 | 38 | 3 | 7.9 |
| 2 | 536 | 14 | 3.3 | 35 | 3 | 15.8 |
| 3 | 519 | 4 | 4.1 | 32 | 0 | 15.8 |
| 4 | 507 | 2 | 4.5 | 31 | 0 | 15.8 |
| 5 | 498 | 3 | 5.0 | 29 | 0 | 15.8 |
| 6 | 485 | 4 | 5.8 | 27 | 1 | 18.9 |
| 7 | 467 | 6 | 7.0 | 26 | 1 | 22.0 |
| 8 | 449 | 4 | 7.9 | 25 | 0 | 22.0 |
| 9 | 441 | 4 | 8.7 | 23 | 1 | 25.4 |
| 10 | 422 | 8 | 10.4 | 22 | 0 | 25.4 |
| 11 | 394 | 7 | 12.0 | 22 | 1 | 28.8 |
| 12 | 375 | 6 | 13.4 | 20 | 0 | 28.8 |
Figure 1: Kaplan-Meier plot of time to death (TF = Tamiflu[oseltamivir])
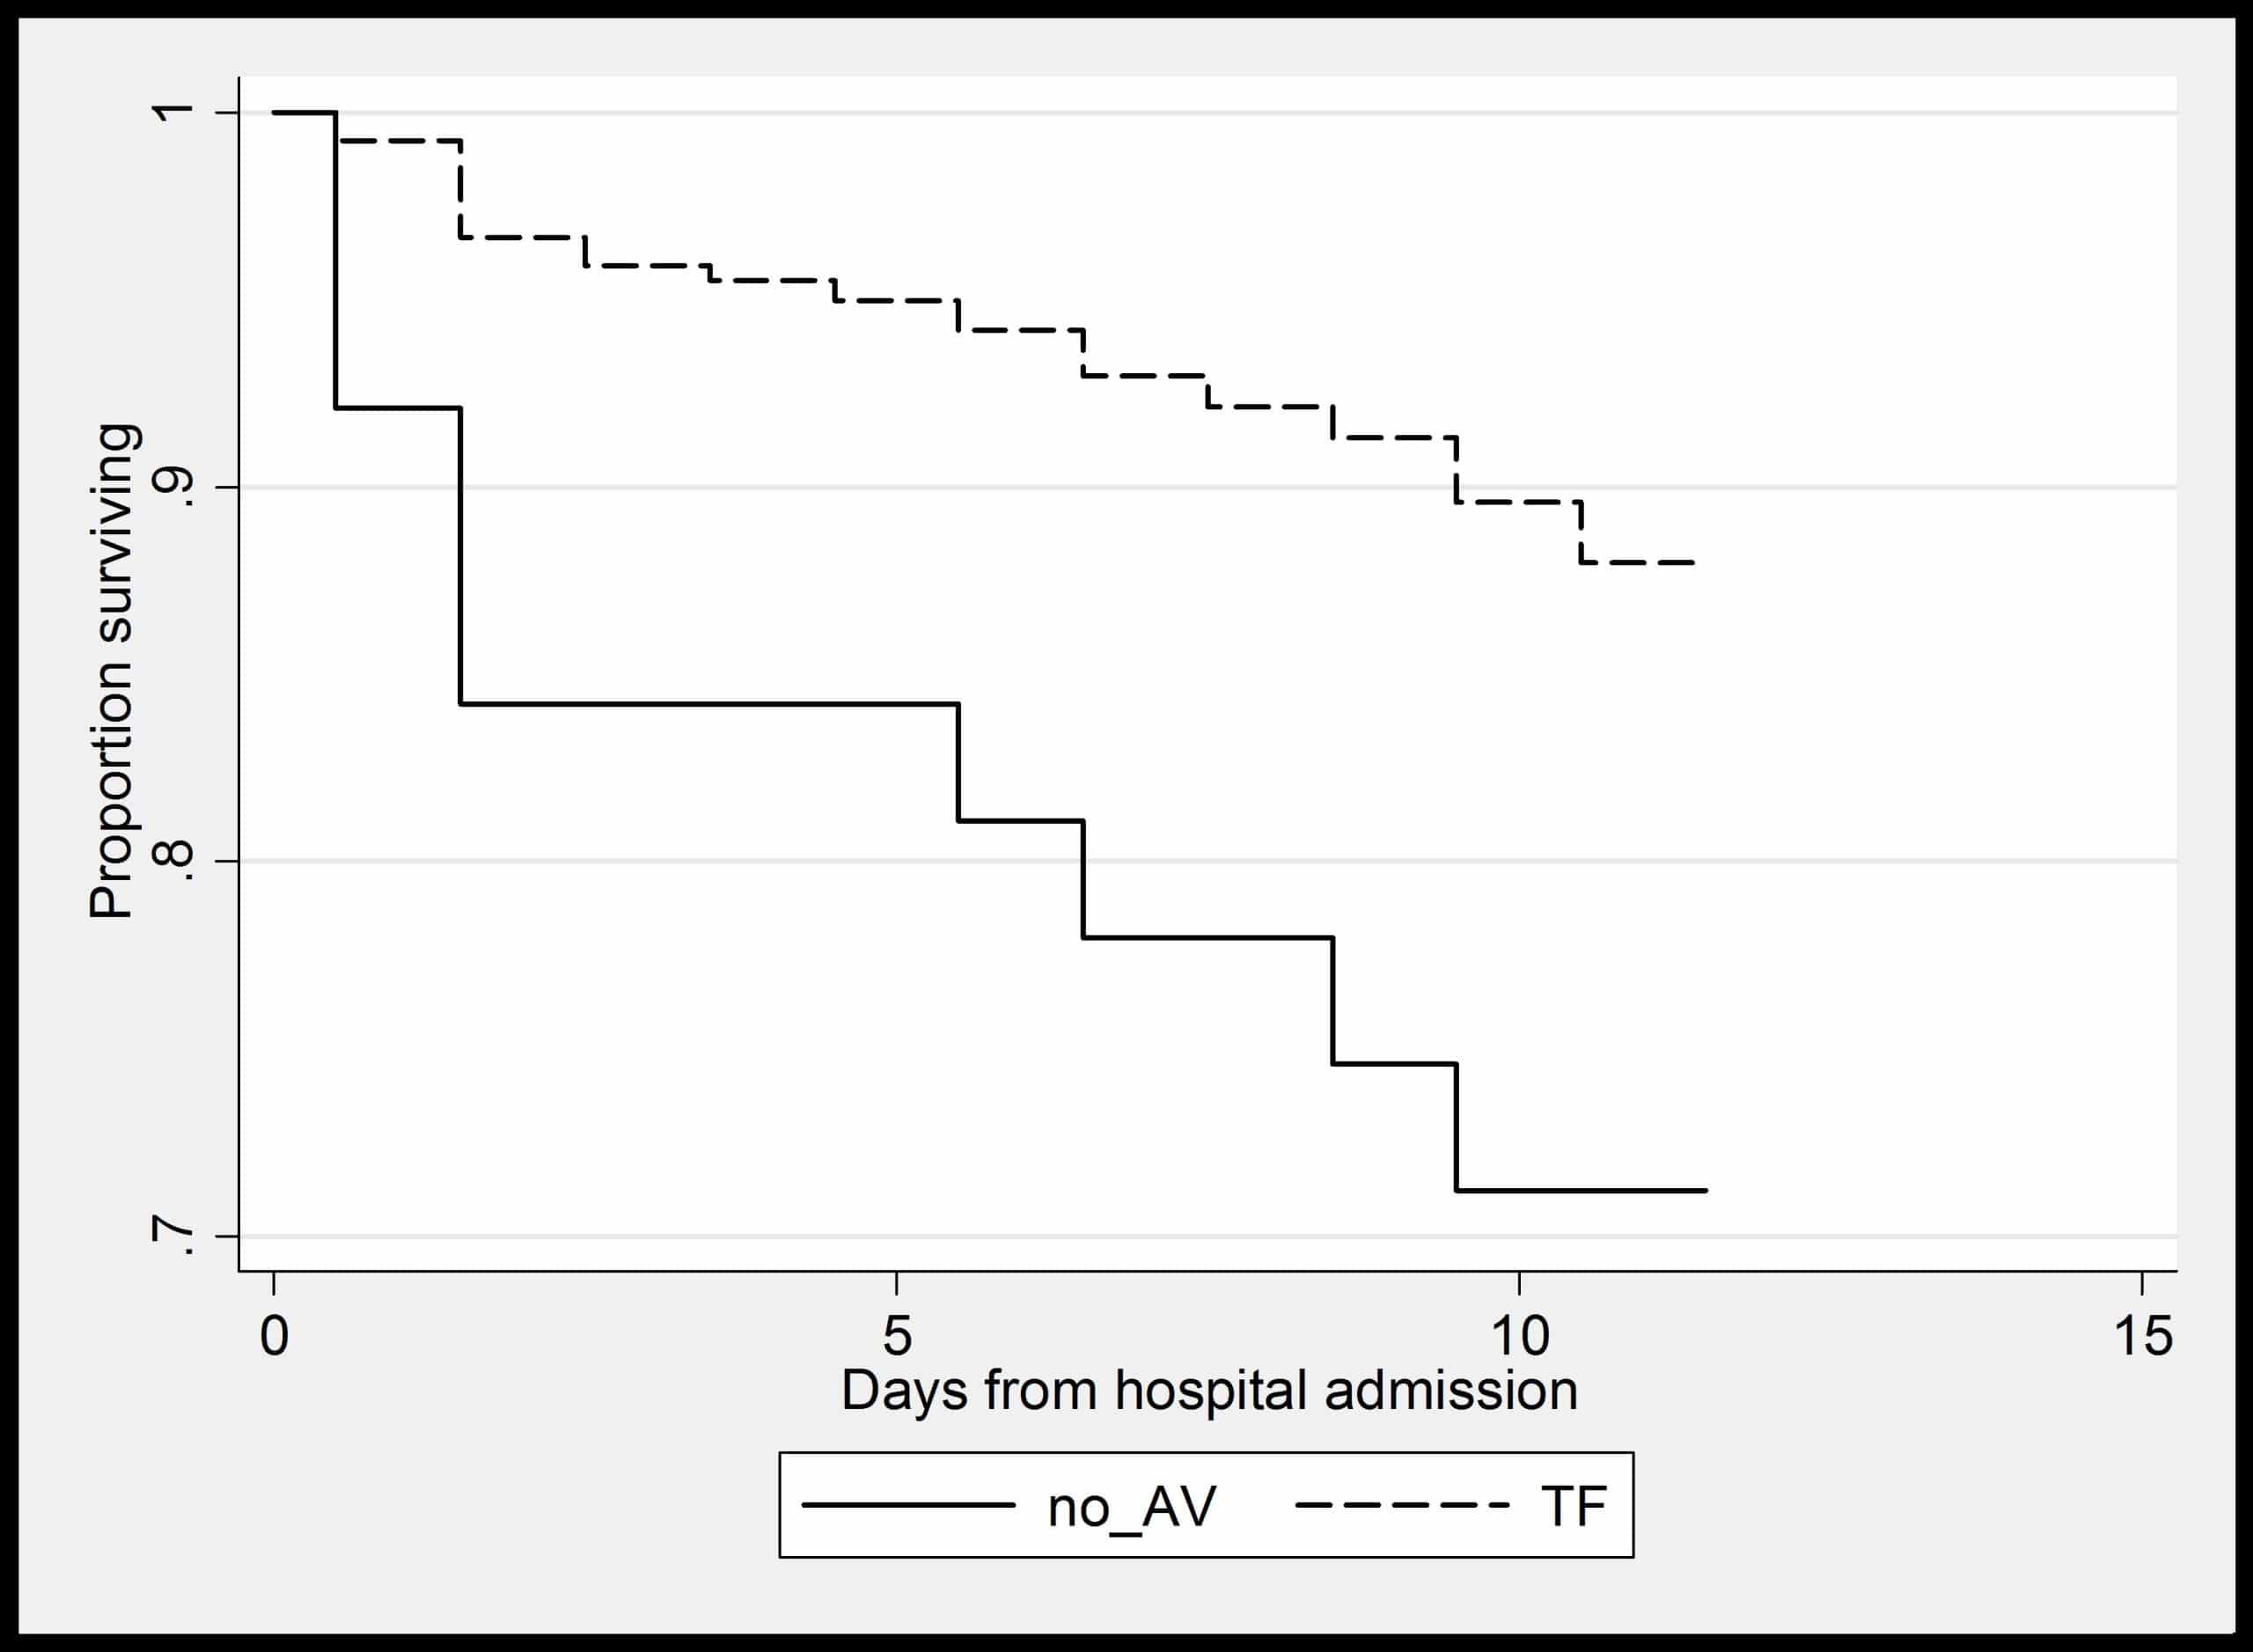
Table 2: Time from admission to death by time dependent treatment status (AV=antiviral)
| Days since admission | Number at risk (AV) | Number dead (AV) | Cumulative mortality (%) (AV) | Number at risk(no AV) | Number dead(no AV) | Cumulative mortality (%) (no AV) |
| 1 | 423 | 4 | 1.0 | 155 | 3 | 2.0 |
| 2 | 484 | 14 | 3.9 | 87 | 3 | 5.5 |
| 3 | 487 | 4 | 4.7 | 64 | 0 | 5.5 |
| 4 | 485 | 2 | 5.1 | 53 | 0 | 5.5 |
| 5 | 481 | 3 | 5.7 | 46 | 0 | 5.5 |
| 6 | 472 | 4 | 6.6 | 40 | 1 | 8.0 |
| 7 | 459 | 6 | 7.9 | 34 | 1 | 11.0 |
| 8 | 442 | 4 | 8.8 | 32 | 0 | 11.0 |
| 9 | 434 | 4 | 9.7 | 30 | 1 | 14.4 |
| 10 | 415 | 8 | 11.7 | 28 | 0 | 14.4 |
| 11 | 388 | 7 | 13.5 | 28 | 1 | 18.0 |
| 12 | 370 | 6 | 14.8 | 25 | 0 | 18.0 |
Figure 2: Survival plot for time dependent treatment exposure (TF = Tamiflu[oseltamivir])
